Dashboard
The Dashboard gives you a quick read on your Zeploy activity. It counts every Zeployment, metadata and records together, and shows how often they succeed.
Steps
Open Dashboard from the sidebar, under Activity.
Read the tiles. Five tiles sit across the top:
- Zeployments: how many runs there have been in total.
- Success rate: the share of runs that Succeeded.
- Failed: how many runs Failed.
- Avg duration: the average time a run took, in seconds. It shows a dash if no run has finished yet.
- Prod / Sandbox: how many runs targeted production and how many targeted a sandbox.
Look at Activity per day. The bar chart below shows how many Zeployments ran on each day that had any. The label under each bar is the month and day.
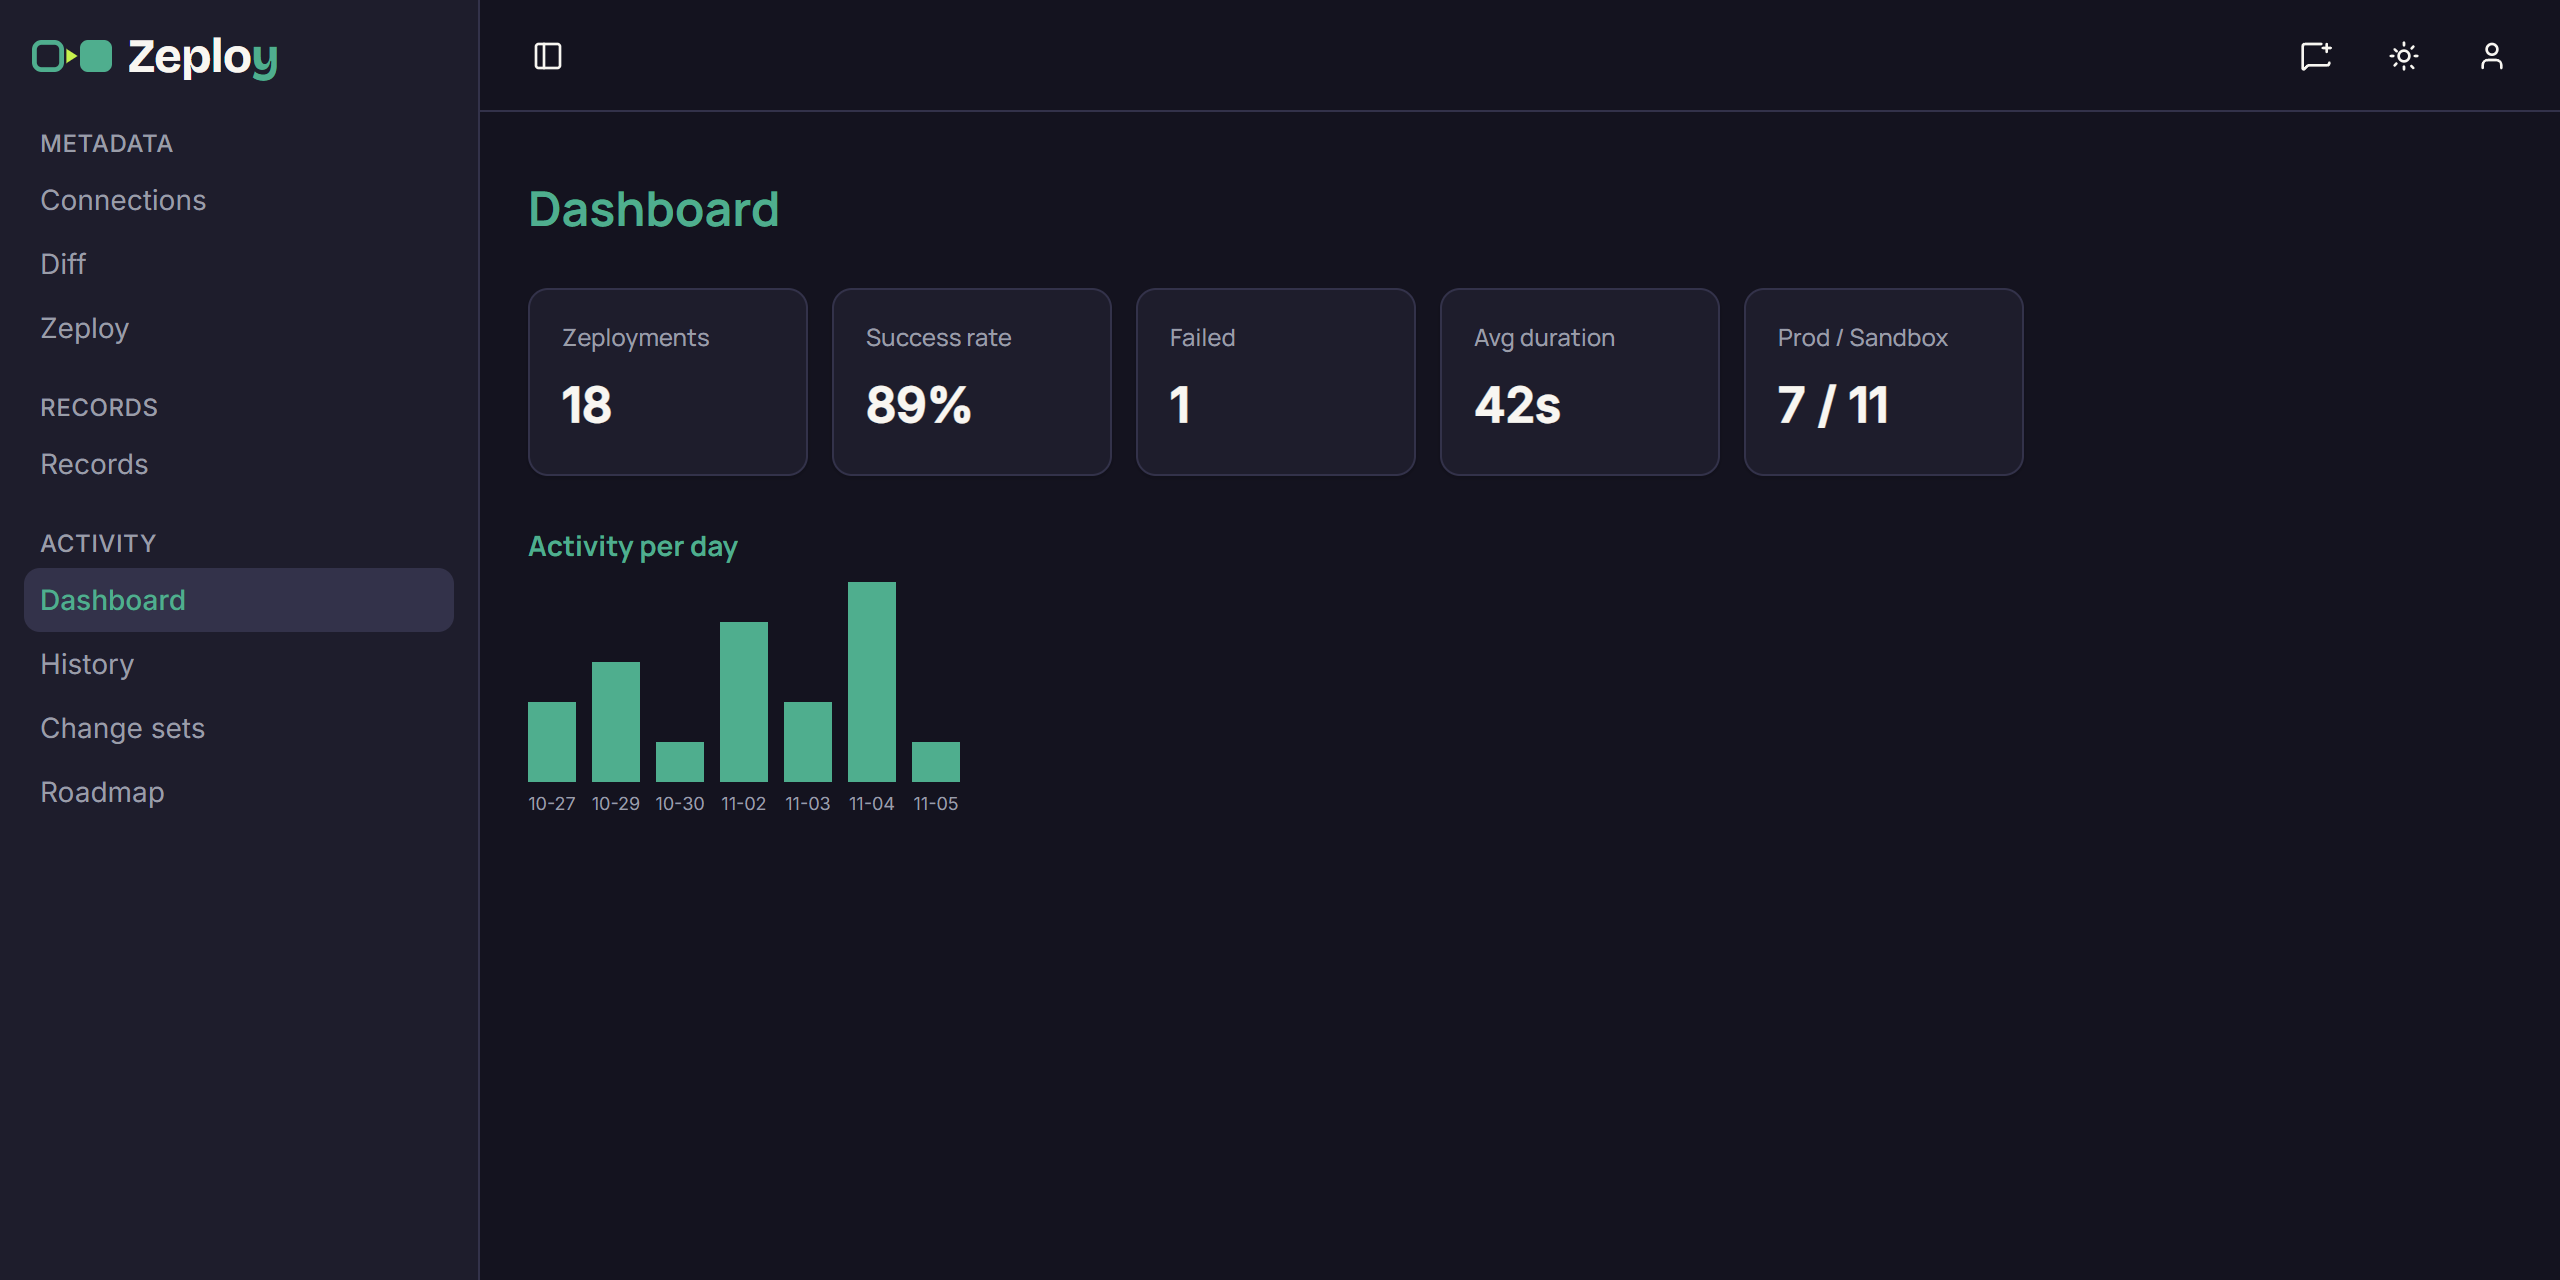
The dashboard tiles and the activity chart Open History to dig in. The Dashboard only shows totals. To see a single run, go to History.
Good to know
- The numbers cover all time. There is no date filter on the page.
- Success rate is Succeeded runs divided by all runs. Runs that are Partial, still running or Failed all count against it.
- Validate runs may be counted along with real Zeployments, so a team that validates a lot can see a larger total.
- An empty chart reads "No activity yet." Run your first Zeployment to fill it in. See Your first Zeployment.